This weeks lab includes working with imagery that contains five bands which are blue, green, red, red edge, and infrared. The difference between working with a red edge sensor and a regular RGB is that it can collect light waves that are between the red and infrared sensor. It also then creates separate images for each of the different bands instead of making one image containing RGB which then have to be separated if needed.
Methods
The first step is to open up Pix4D, which can be used to process the images taken by the platform. This is done by choosing the Ag-Multispectral Processing Template (Figure 1), but when choosing this template in the processing options the orthomosaic option needs to be checked so it is made to later be used in ESRI's program.
 |
| Figure 1: When starting the new project select Ag Multispectral. Obtained from Pix4D Support Website. |
Next, after Pix4D is finished processing the images, open ArcGIS Pro or ArcMap and in the search bar type in composite band. This allows the user to combine the bands to create a composite. The bands need to be entered in the order: blue, green, red, red edge, and IR (Figure 2). Once this is finished a composite will be generated which will allow the user to start on the end goal of creating a impermeable vs permeable map for this specific lab.
After, generating the composite image the next step is to run the segment mean shift tool (Figure 3) This smooths out the image to allow for easier classification in later steps. For this the spectral detail was changed to 8 and 2 for the parameters. This should take a few minutes, but depends on the size of the image.
 |
| Figure 3: This is the segment mean shift tool. This allows the user to create a more general looking image to create classes from. |
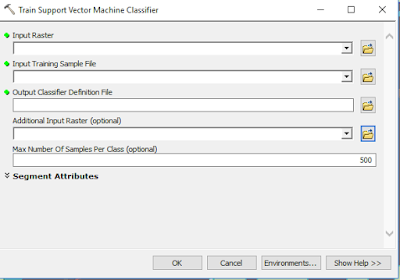
Next, is to go into the toolbars and find the image classification bar. Then combine the same classes of road, driveway, roof, shadow, field, grass, farm area (Figure 4). Then once finish save the file to be used in the next tool. The next tool is the train the train support vector machine classifier. This allows the program to sort the pixels into different classes based on the image classification file.
 |
| Figure 4: This tool creates samples to use to train the classifier in the next step. It is important to make separate classes to make the different layers. |
Once the tool from the previous step is finished the next step is to reclassify. To do this use the reclassify tool and change the classes that are impermeable to 0 and the classes that are permeable to 1. This allows the user to create a simple map that shows what area are permeable.
 |
| Figure 5: This tool allows the raster to be classified into the categories created in Figure 4. This will create a new image that can be then reclassified into a final map. |
 |
| Figure 6: An RGB map of the Study Area. |
 |
| Figure 7: A false Color IR of the study area. |
 |
| Figure 8: A Red Edge image of the study area. |
 |
| Figure 9: NDVI of the study area showing crop health. |
 |
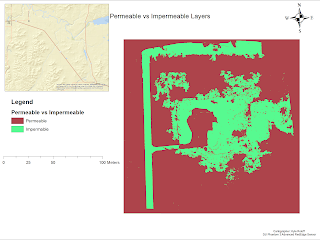
| Figure 10: Permeable vs Impermeable layers. Not well created from the training sample vector machine. |
Discussion
This lab seemed to be one of the more nit-picky labs in terms of file management and making sure everything was saved in the correct place to be used. It also was helpful to look back at the previous lab and even bring in the same tools. The map created for the impermeable vs permeable area was not easily created and does not even come close to perfectly showing what it should be. The shadow of the house was included in the house instead of the vegetation, and there are random areas in the upper right that are classified as house instead of vegetation. There is also not a neat line that goes along the road and instead gives a more of a fuzzy look. It also did not classify the house as even being impermeable, and rather put around the house as the impermeable area (Figure 10). This would not indicate the best way for determine the permeable vs impermeable layers. Using the classifying tool does not give the highest accuracy and should be used with caution. In Figure 9 there is a NDVI showing the plant health. This is an interesting figure because it shows around the house that there is very healthy green grass that can be seen in Figure 6. It also shows farther away from the house where the land is less likely to be cared for in the same fashion as the grass near the house, shows that the quality is diminished for plant health. With this type of sensor there area many different types of application. It can look at agriculture health to determine what areas need to be watered, and by using the rededge sensor the user can select which bands to look like without having to extract them because they are already extracted.
Conclusion
UAS can be a tool by using a rededge sensor for agriculture use. If someone was taught how to use a UAS the user could potentially every day use the UAS to figure out which fields need to be watered compared to the ones that do not. This can save water and time spent on watering fields that are not needing it as much. With the red edge senor having five separated bands it creates more uses that can be looked at with different types of images and not just RGB. It can look at RedEdge, IR, or False color IR. For rededge the most applied use will be within agriculture.

No comments:
Post a Comment