This weeks lab is to use an application for UAS that determines the volume within a stockpile. UAS is a great tool for this because the images taken with the drone can be processed in Pix4D and also processed in ArcMap to determine the accuracy. Using a UAS to determine the stock pile size is a way to reduce spending and increase the amount of times this can be done because an UAS could be sent into the air everyday to collect this data if it was needed. For this lab there will be three different stock piles calculated using a few different methods.
o Raster Clip - Allows the user to clip the desired shape out of the entire raster.
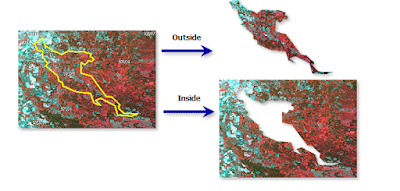 |
| Figure 1: Showing how a raster clip works. |
o Raster to Tin - This tools allows the user to convert a raster to a TIN data set. This does not create a better surface based on quality.
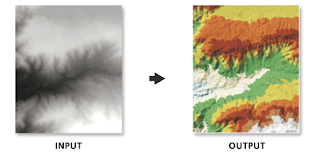 |
| Figure 2: Raster to TIN. |
o Add Surface Information - This tool adds attribute features with spatial information that was found from the surface.
o Surface Volume - This tool calculates the surface volume of a region between a surface and the reference plane (possibly DEM vs TIN dataset).
o Polygon Volume - calculates the surface volume between polygon and TIN surface.
o Cut Fill - Calculates the volume changes between two surfaces. This is determined by a sequential value that is given to each unique edge-connected area of cut, fill, or no change. This is the toolbox operation that requires temporal data and not just one dataset.
The tools that will be used in this lab have not yet been used for this class therefore a detailed sections of them will be defined:
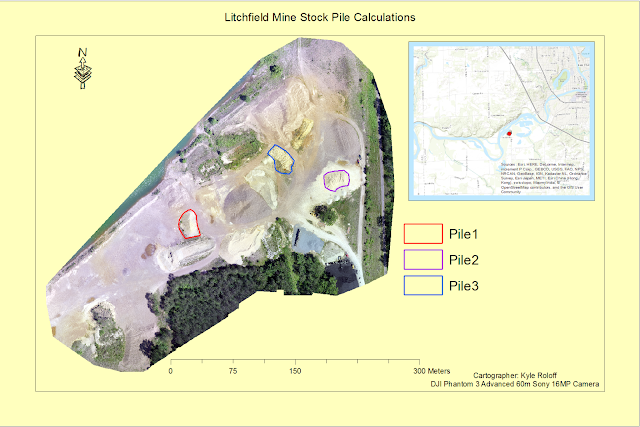 |
| Map 1: Image showing the piles and what number is each for discussion below. |
Methods
Pix4D
The first step is to transfer the data from the previous lab into a new folder to start working on it. This will be the Litchfield Mine data with both flight 1 and flight 2 data merged together as done in the previous labs. Next, is to select the volumes on the left side of Pix4D and then the add volume symbol in the objects menu that pops up. Then select three different stocks piles and calculate the volumetrics for these piles the piles selected can be seen in Figure #.
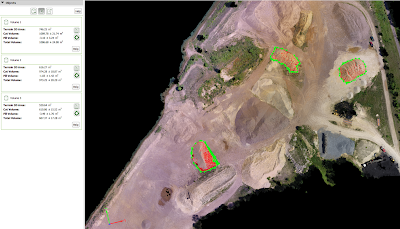 |
| Figure 4: Showing the volumes and stockpiles chosen for the calculations. Bottom = Volume 1 Right = Volume 2 Middle = Volume 3. |
Raster (ArcMap)
The first step for calculating volumes in ArcMap is to open the mosaic created from Pix4D and then create a geodatabase and 1 feature class for each pile. When creating a feature class make sure it is a polygon feature and the correct coordinate system is used. For this lab WGS 1984 Zone 15N was used.
Now, digitize the three piles which can be used with the extract by mask tool. Then add in the DSM image. Next is to used the Extract by Mask tool, and for this tool the parameters are as shown in Figure 5 with the input raster being the DSM and the input raster or feature mask being one of the three digitized piles.
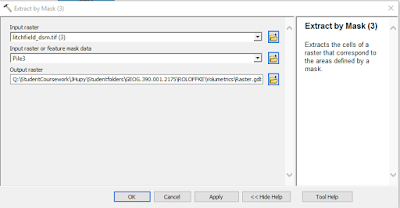 |
| Figure 5: Showing Extract by Mask Tool Parameters used. |
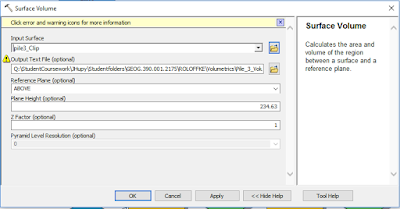 |
| Figure 6: Surface volume tool. |
 |
| Figure 7: Showing the attribute table created to generate the volume of the pile. |
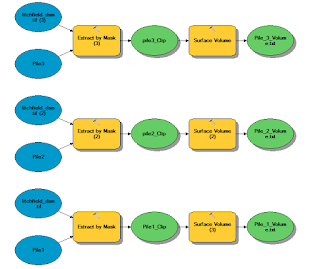 |
| Figure 8: Model Builder showing the process to generate the volume data set. |
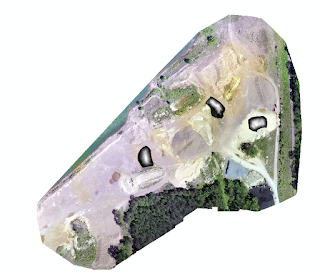 |
| Figure 9: This is an image showing the piles used along with the clip to show the Extract by Mask Tool. |
TIN Volume Calculation
The first step is to convert the rasters created after the mask to TIN files using the Raster to TIN tool. The next step is to use the add surface information tool to add the z_mean and z_min field to the Tin files of each of the piles due to the TIN creation not carrying any information during the Raster to TIN tool (Figure 10) (Figure 11). Finally, The polygon volume tool is used to input the volume into the original feature classes created the parameters can be seen in (Figure 12). Also in (Figure 13) there is a whole model builder showing the pathways created for this information to be created.
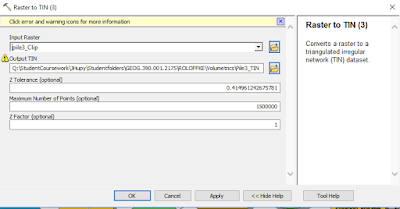 |
| Figure 10: Raster to TIN tool. |
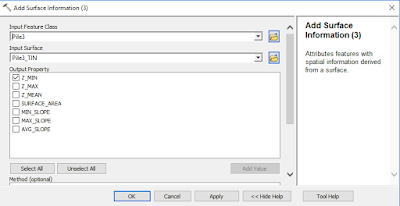 |
| Figure 11: Surface information Tool. |
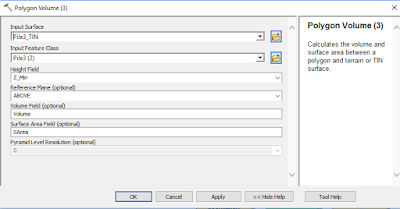 |
| Figure 12: Polygon Volume Tool |
This is the table displaying the information calculated in the Pix4D, Raster, and TIN Volume calculations.
Discussion
The numbers generated in the volume calculations are all variant of each other and are not going to be 100% accurate. The polygons that were used between Arcmap and Pix4D are not going to be the same due to having to be draw two different times making this a point of inaccuracy. A way to fix this would be to possibly take a screen shot from Pix4D and georeference the image to Arcmap to create as close as accurate boundaries as possible, but there is still a difference between the raster and TIN which uses the same feature classes and still comes up with different numbers. For example, Pile 1 went from 695 to 1202.7 in the raster to TIN, and comparing this to the Pix4D value of 1086 it does not make sense for the raster version to come out at such a low value of 695.
The easiest of the three to do this was the Pix4D version due to just having to create polygons around the piles to calculate a volume which is perfect for getting an estimate quickly. The raster also seemed to be easy, and could even become more accurate if going out in the field with a gps to get the exact boundary of the pile. The TIN version well also relatively easy did not seem to create an accurate number because of the way the triangles align which may mess with the elevation levels. Therefore, there may not be a perfect way for doing this making these three way each capable in their own way.


No comments:
Post a Comment